2022 Niue Census of Population and Housing Report
The main purpose of this report is to make the 2022 Niue census information accessible to as many users as possible, and to contribute to the informed decision-making across government agencies, the private sector and the general public.
Niue’s population at the time of the 2022 census (11th November 2022) was 1,681 people, of whom 1,564 (93%) considered Niue to be their place of usual residence. This represents a decrease of 38 compared to the 2017 census.
The average annual rate of population decrease was 0.4%, not including visitors the rate of decrease was 0.3%.
The population density of Niue is 6.0 people per square kilometer. The average household size of Niue was 3.3.
Niue’s current total fertility rate (the average number of children the women in Niue can expect to have during their lifetime at prevailing fertility rates) is 2.94.
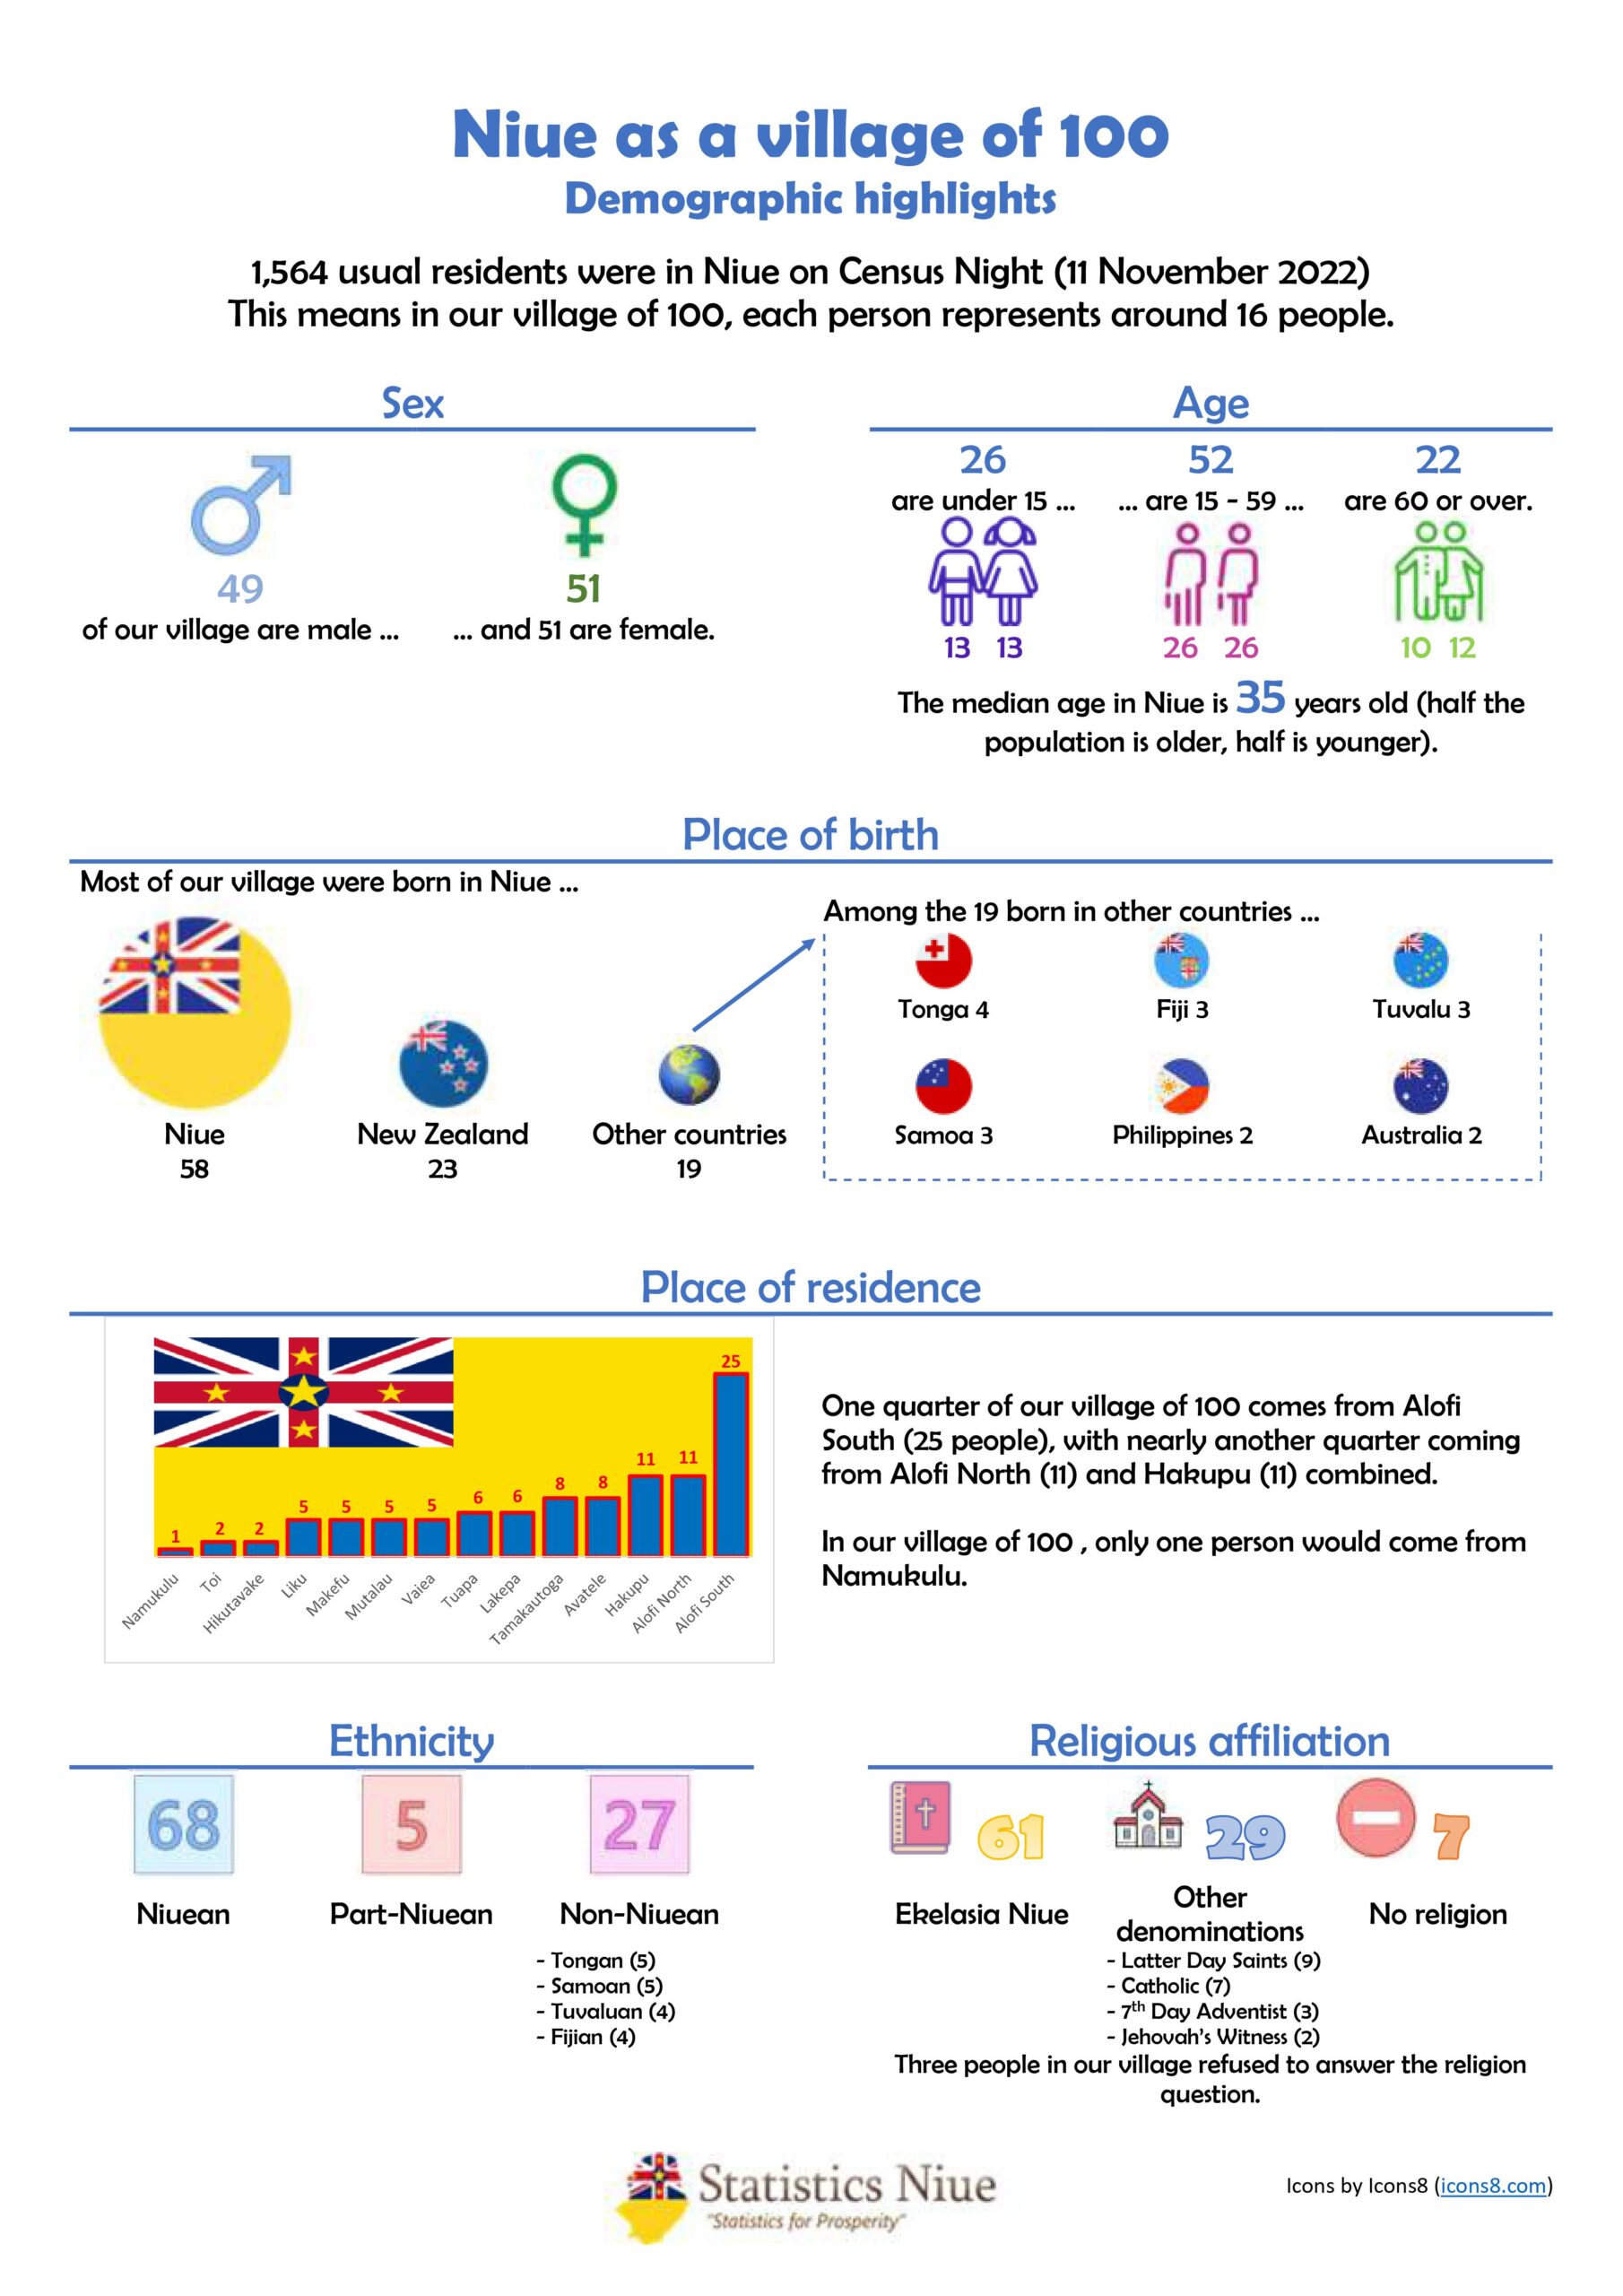
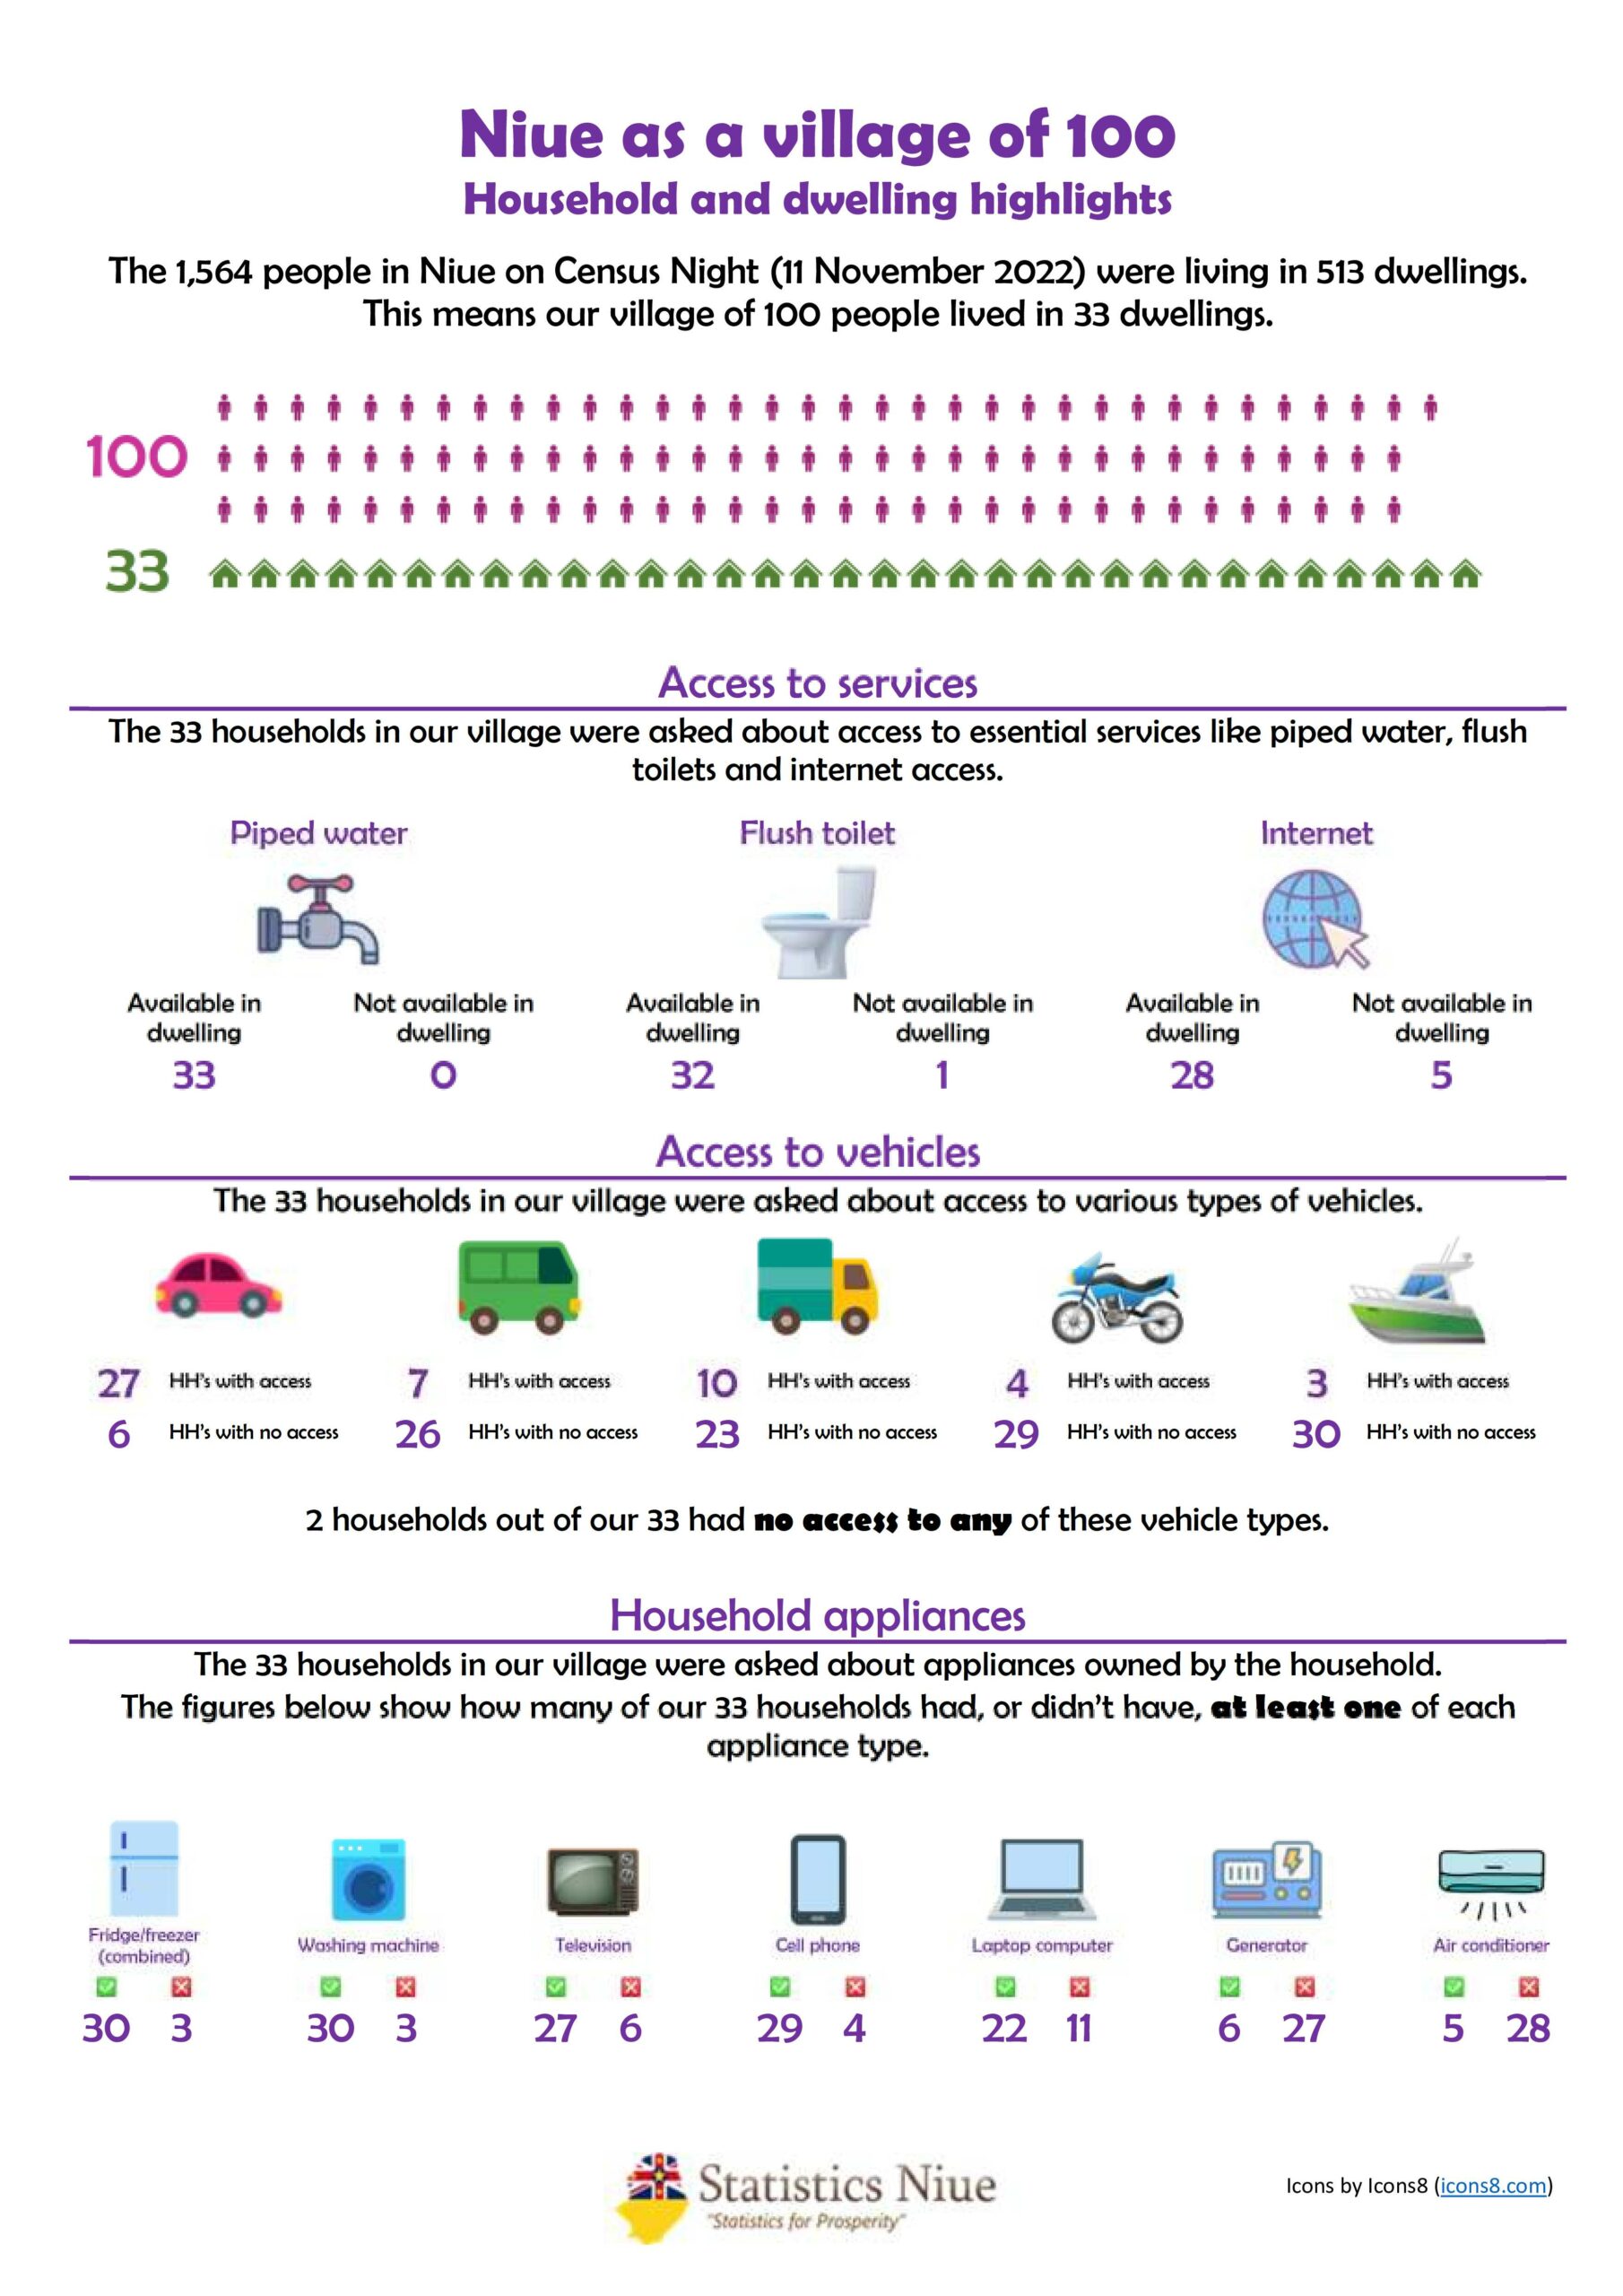
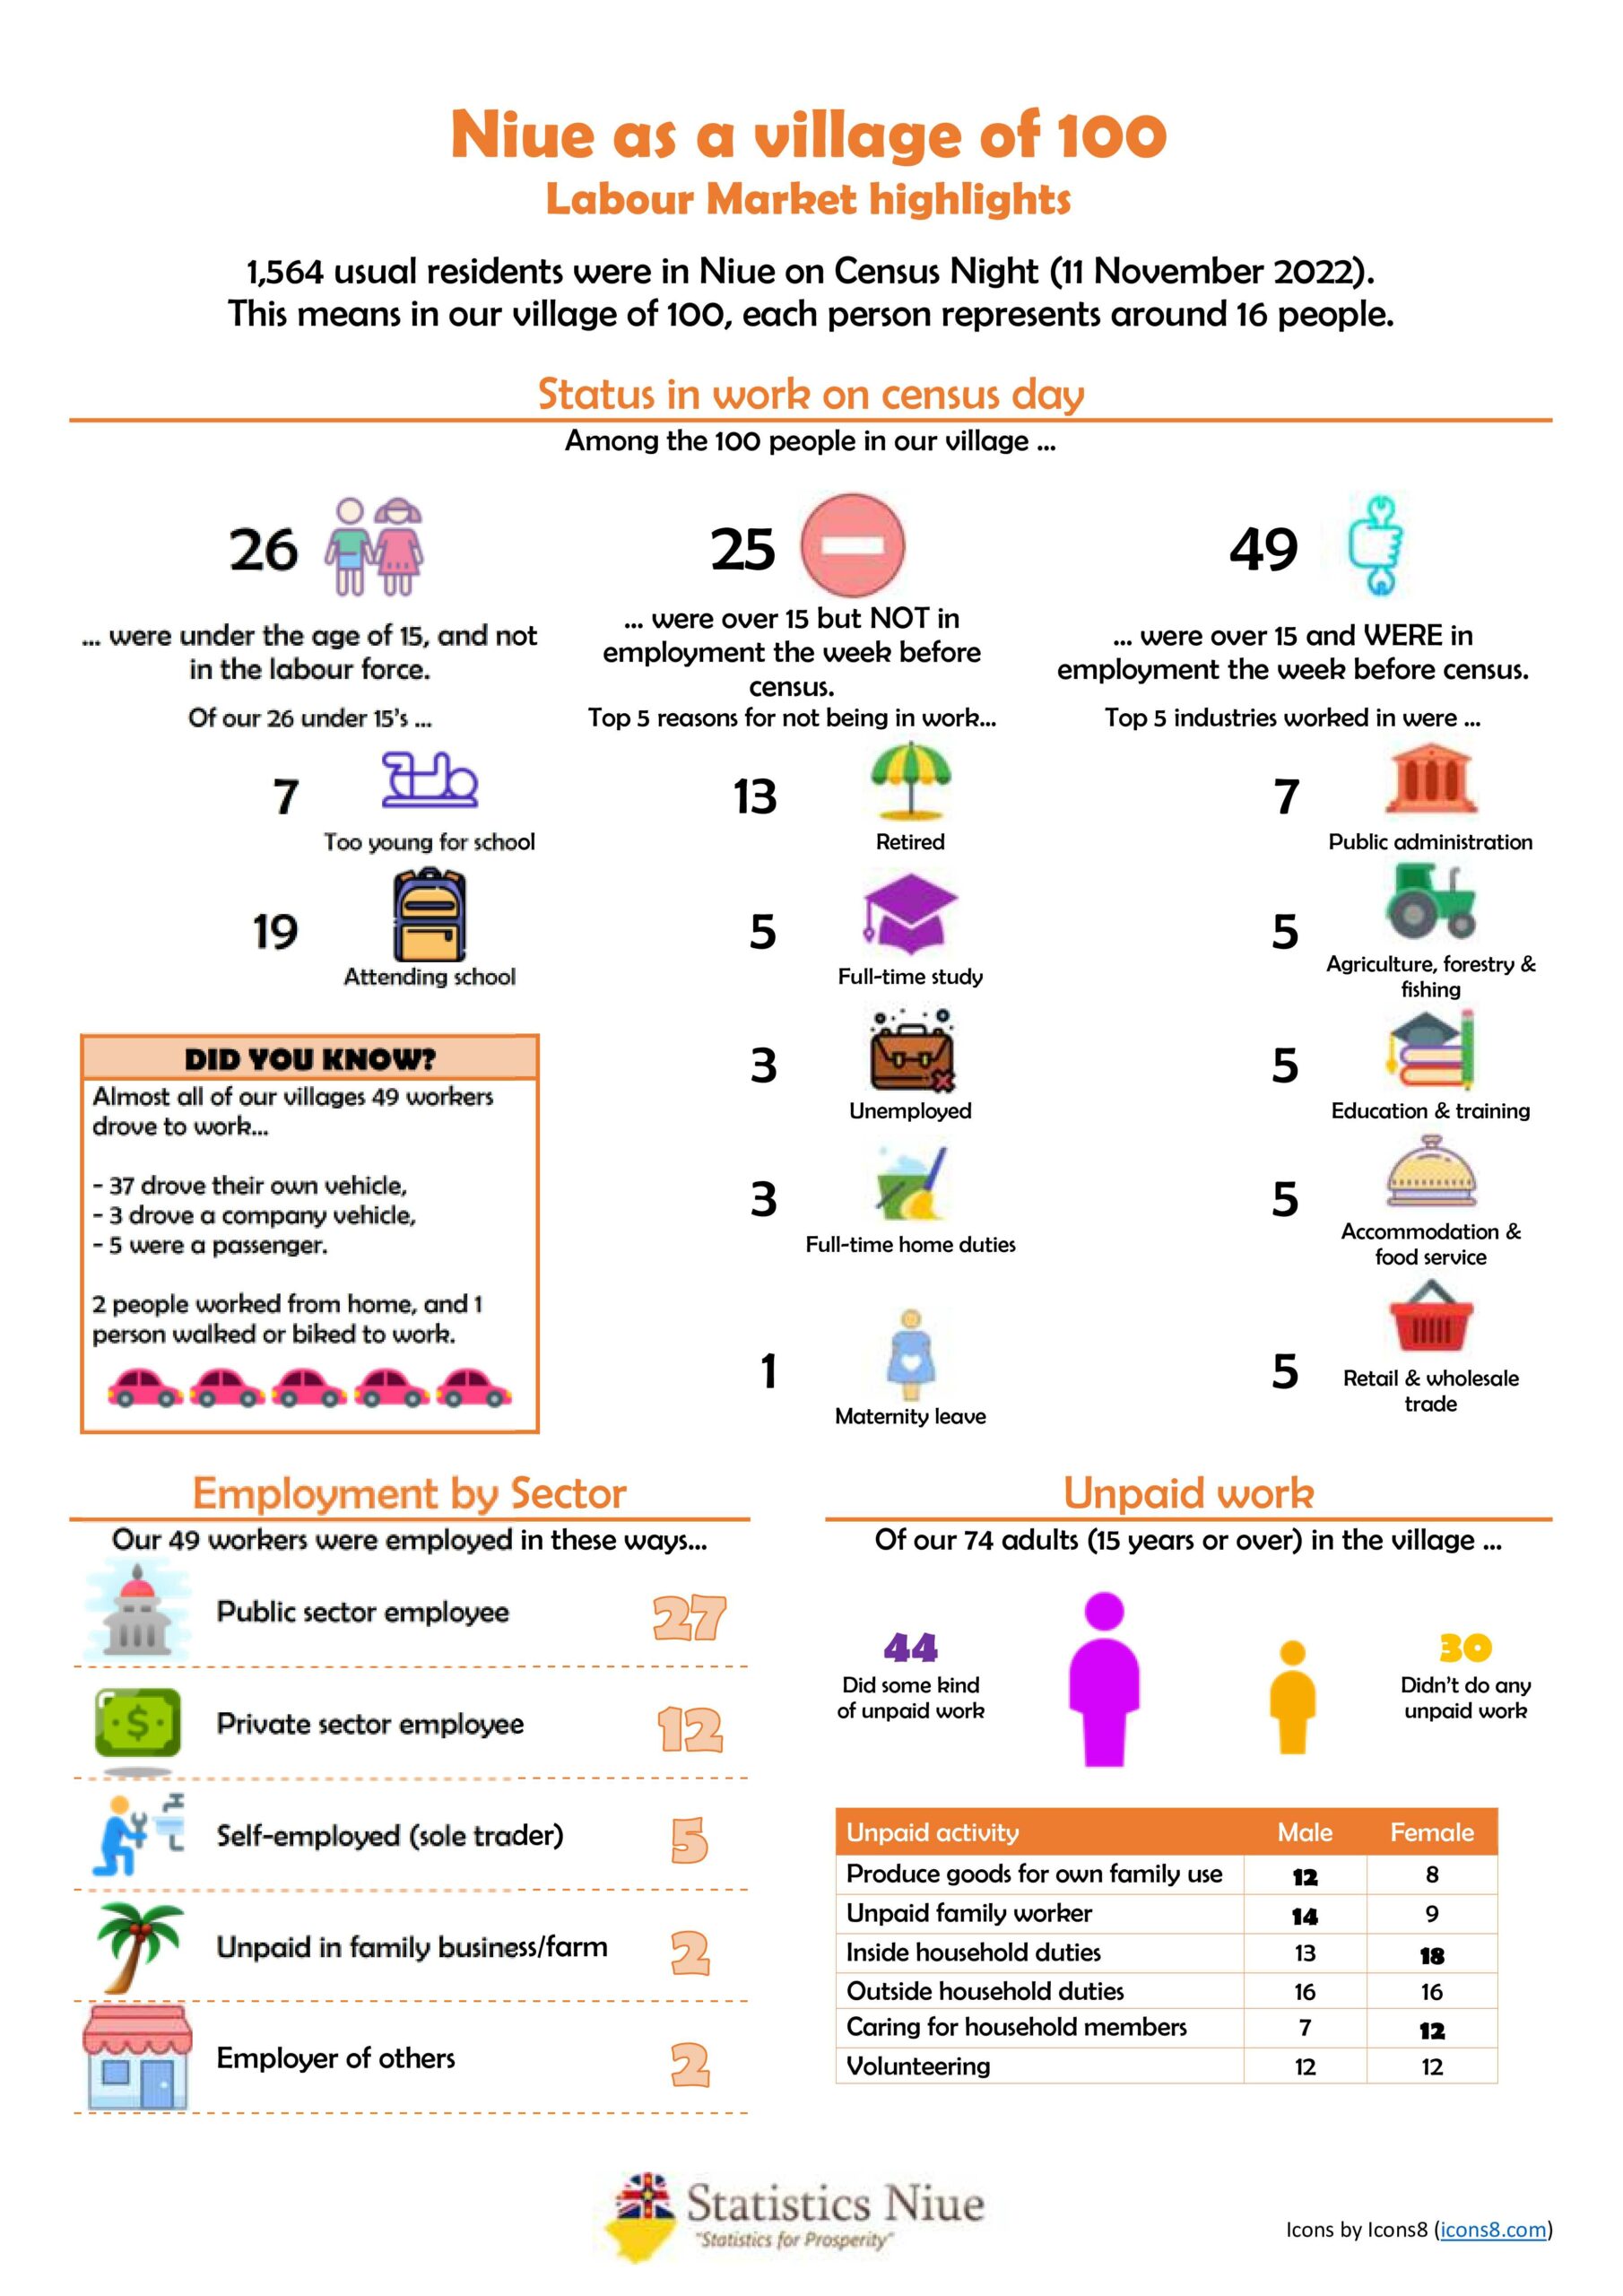
The following are a series of five posters developed to communicate data highlights across the various themes in the report. These are available for download below as pdf files:
NIUE AS A VILLAGE OF 100
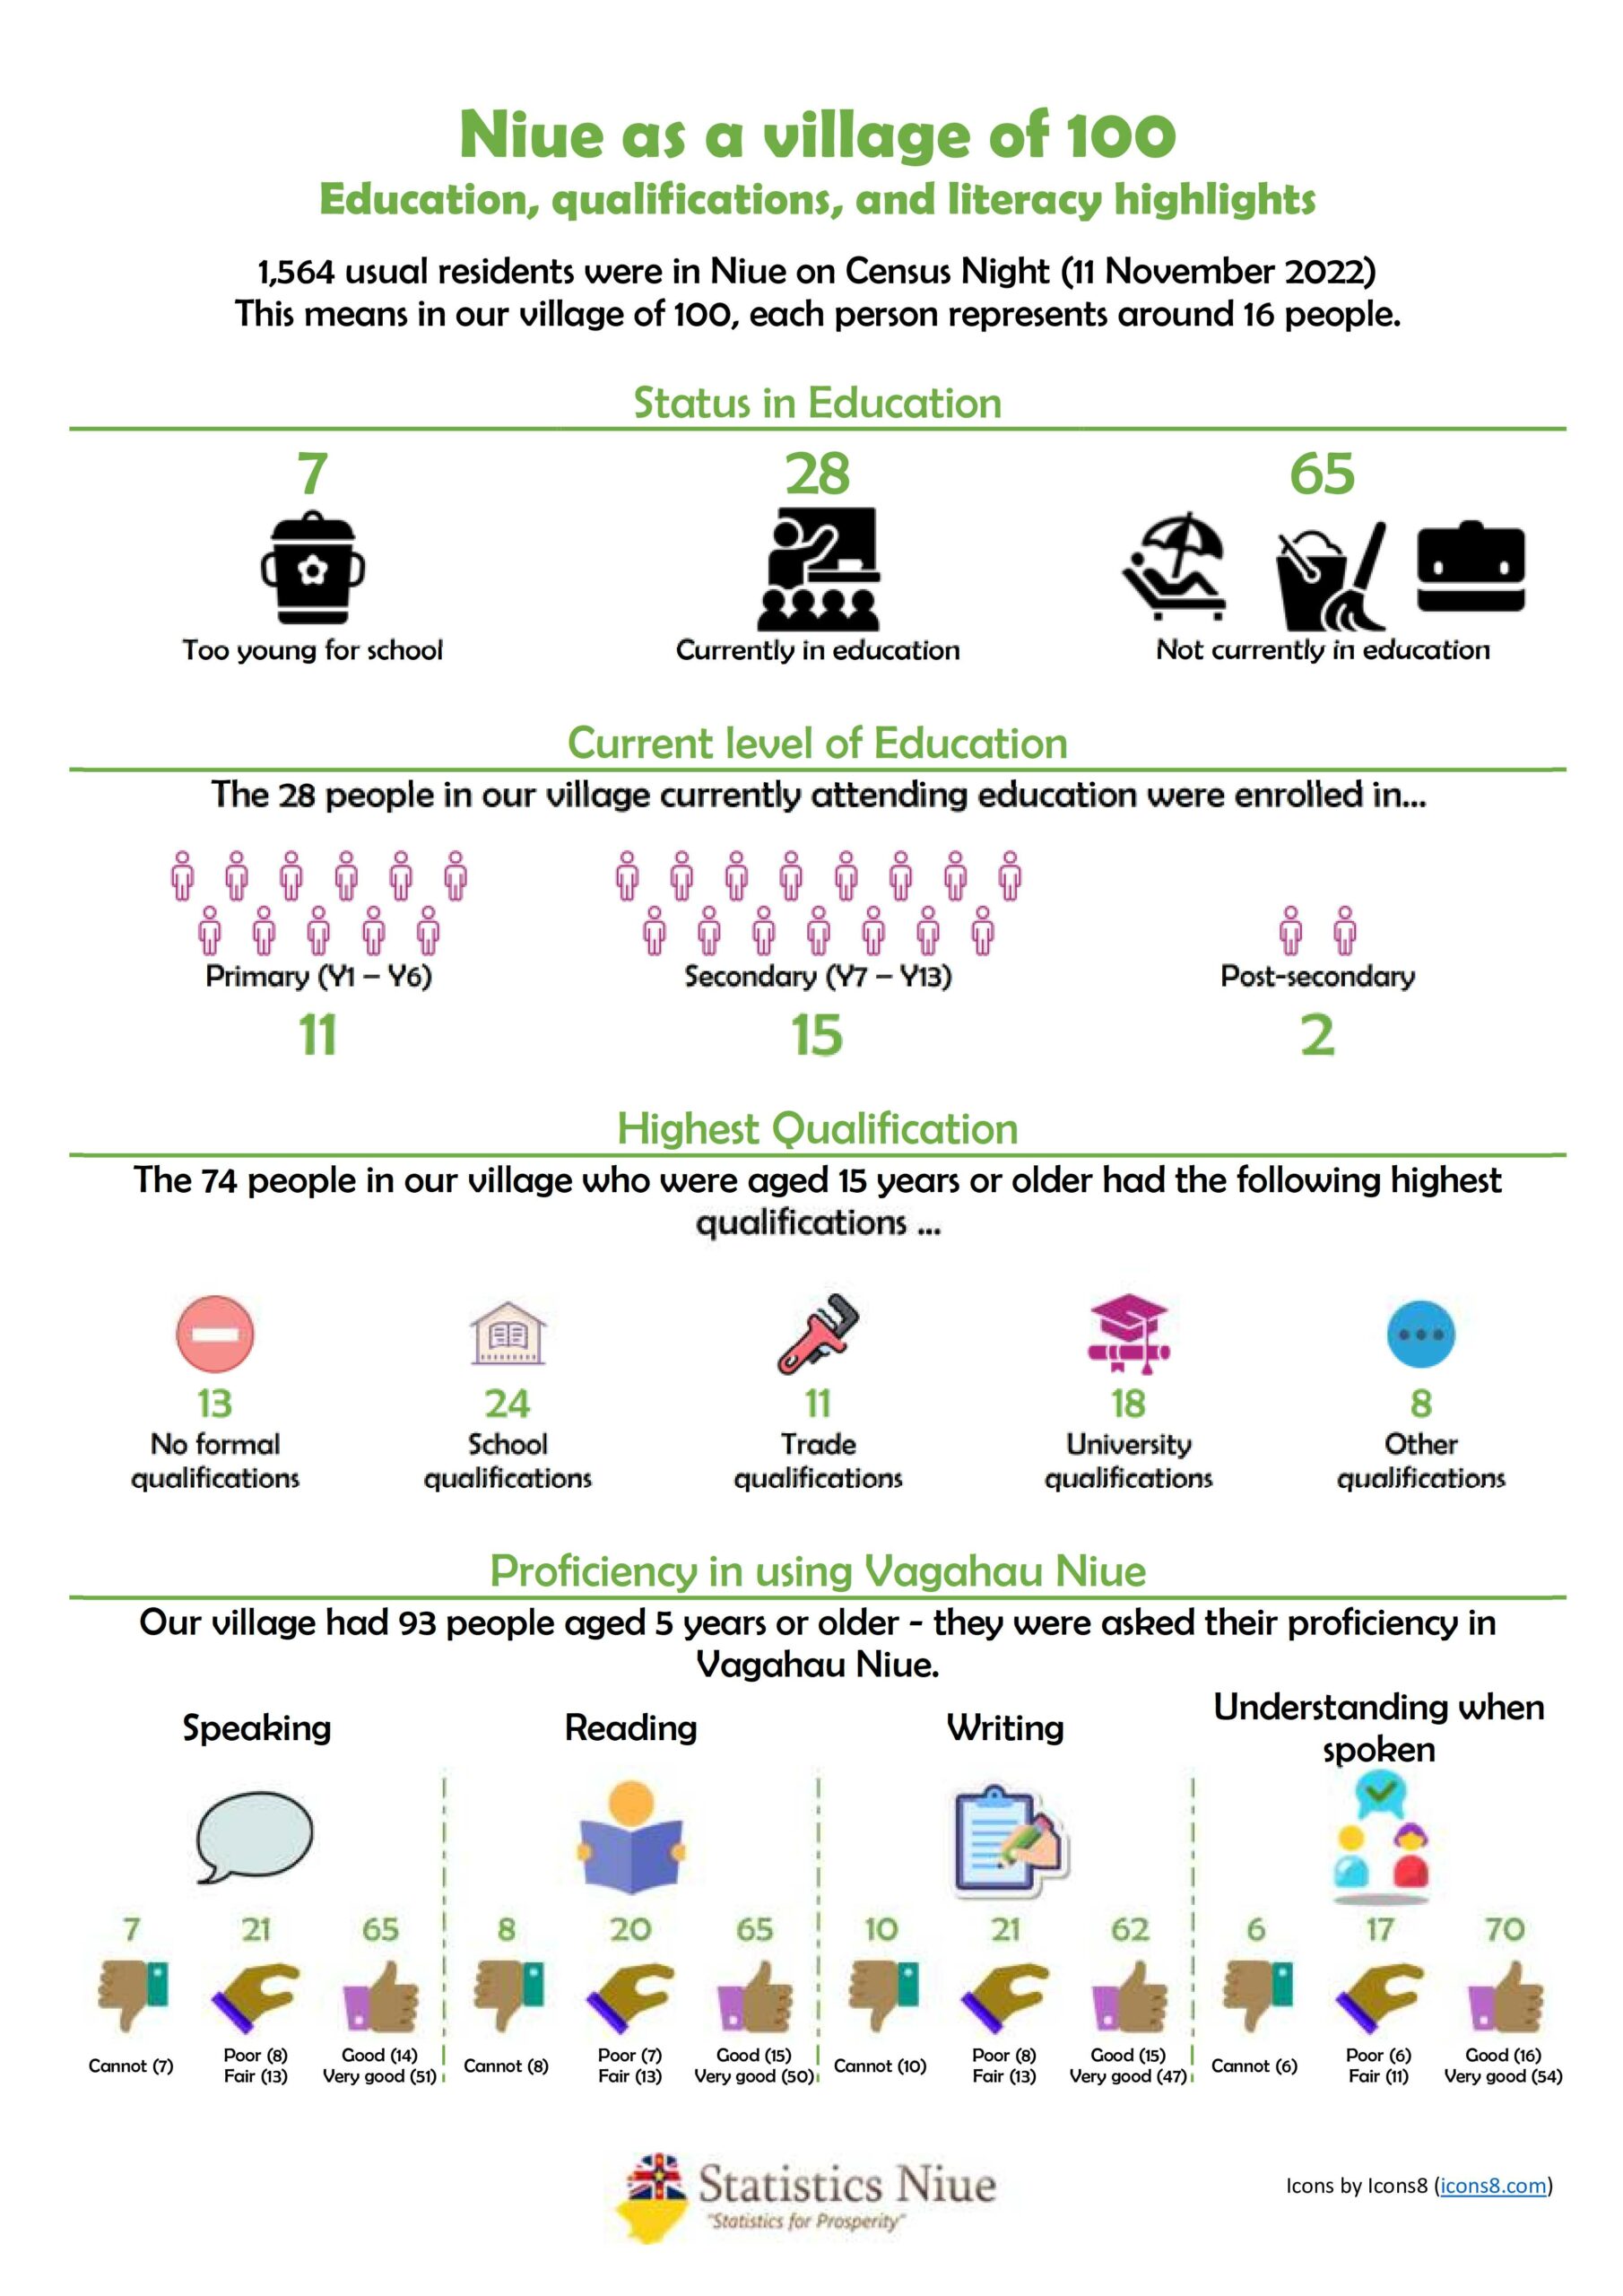
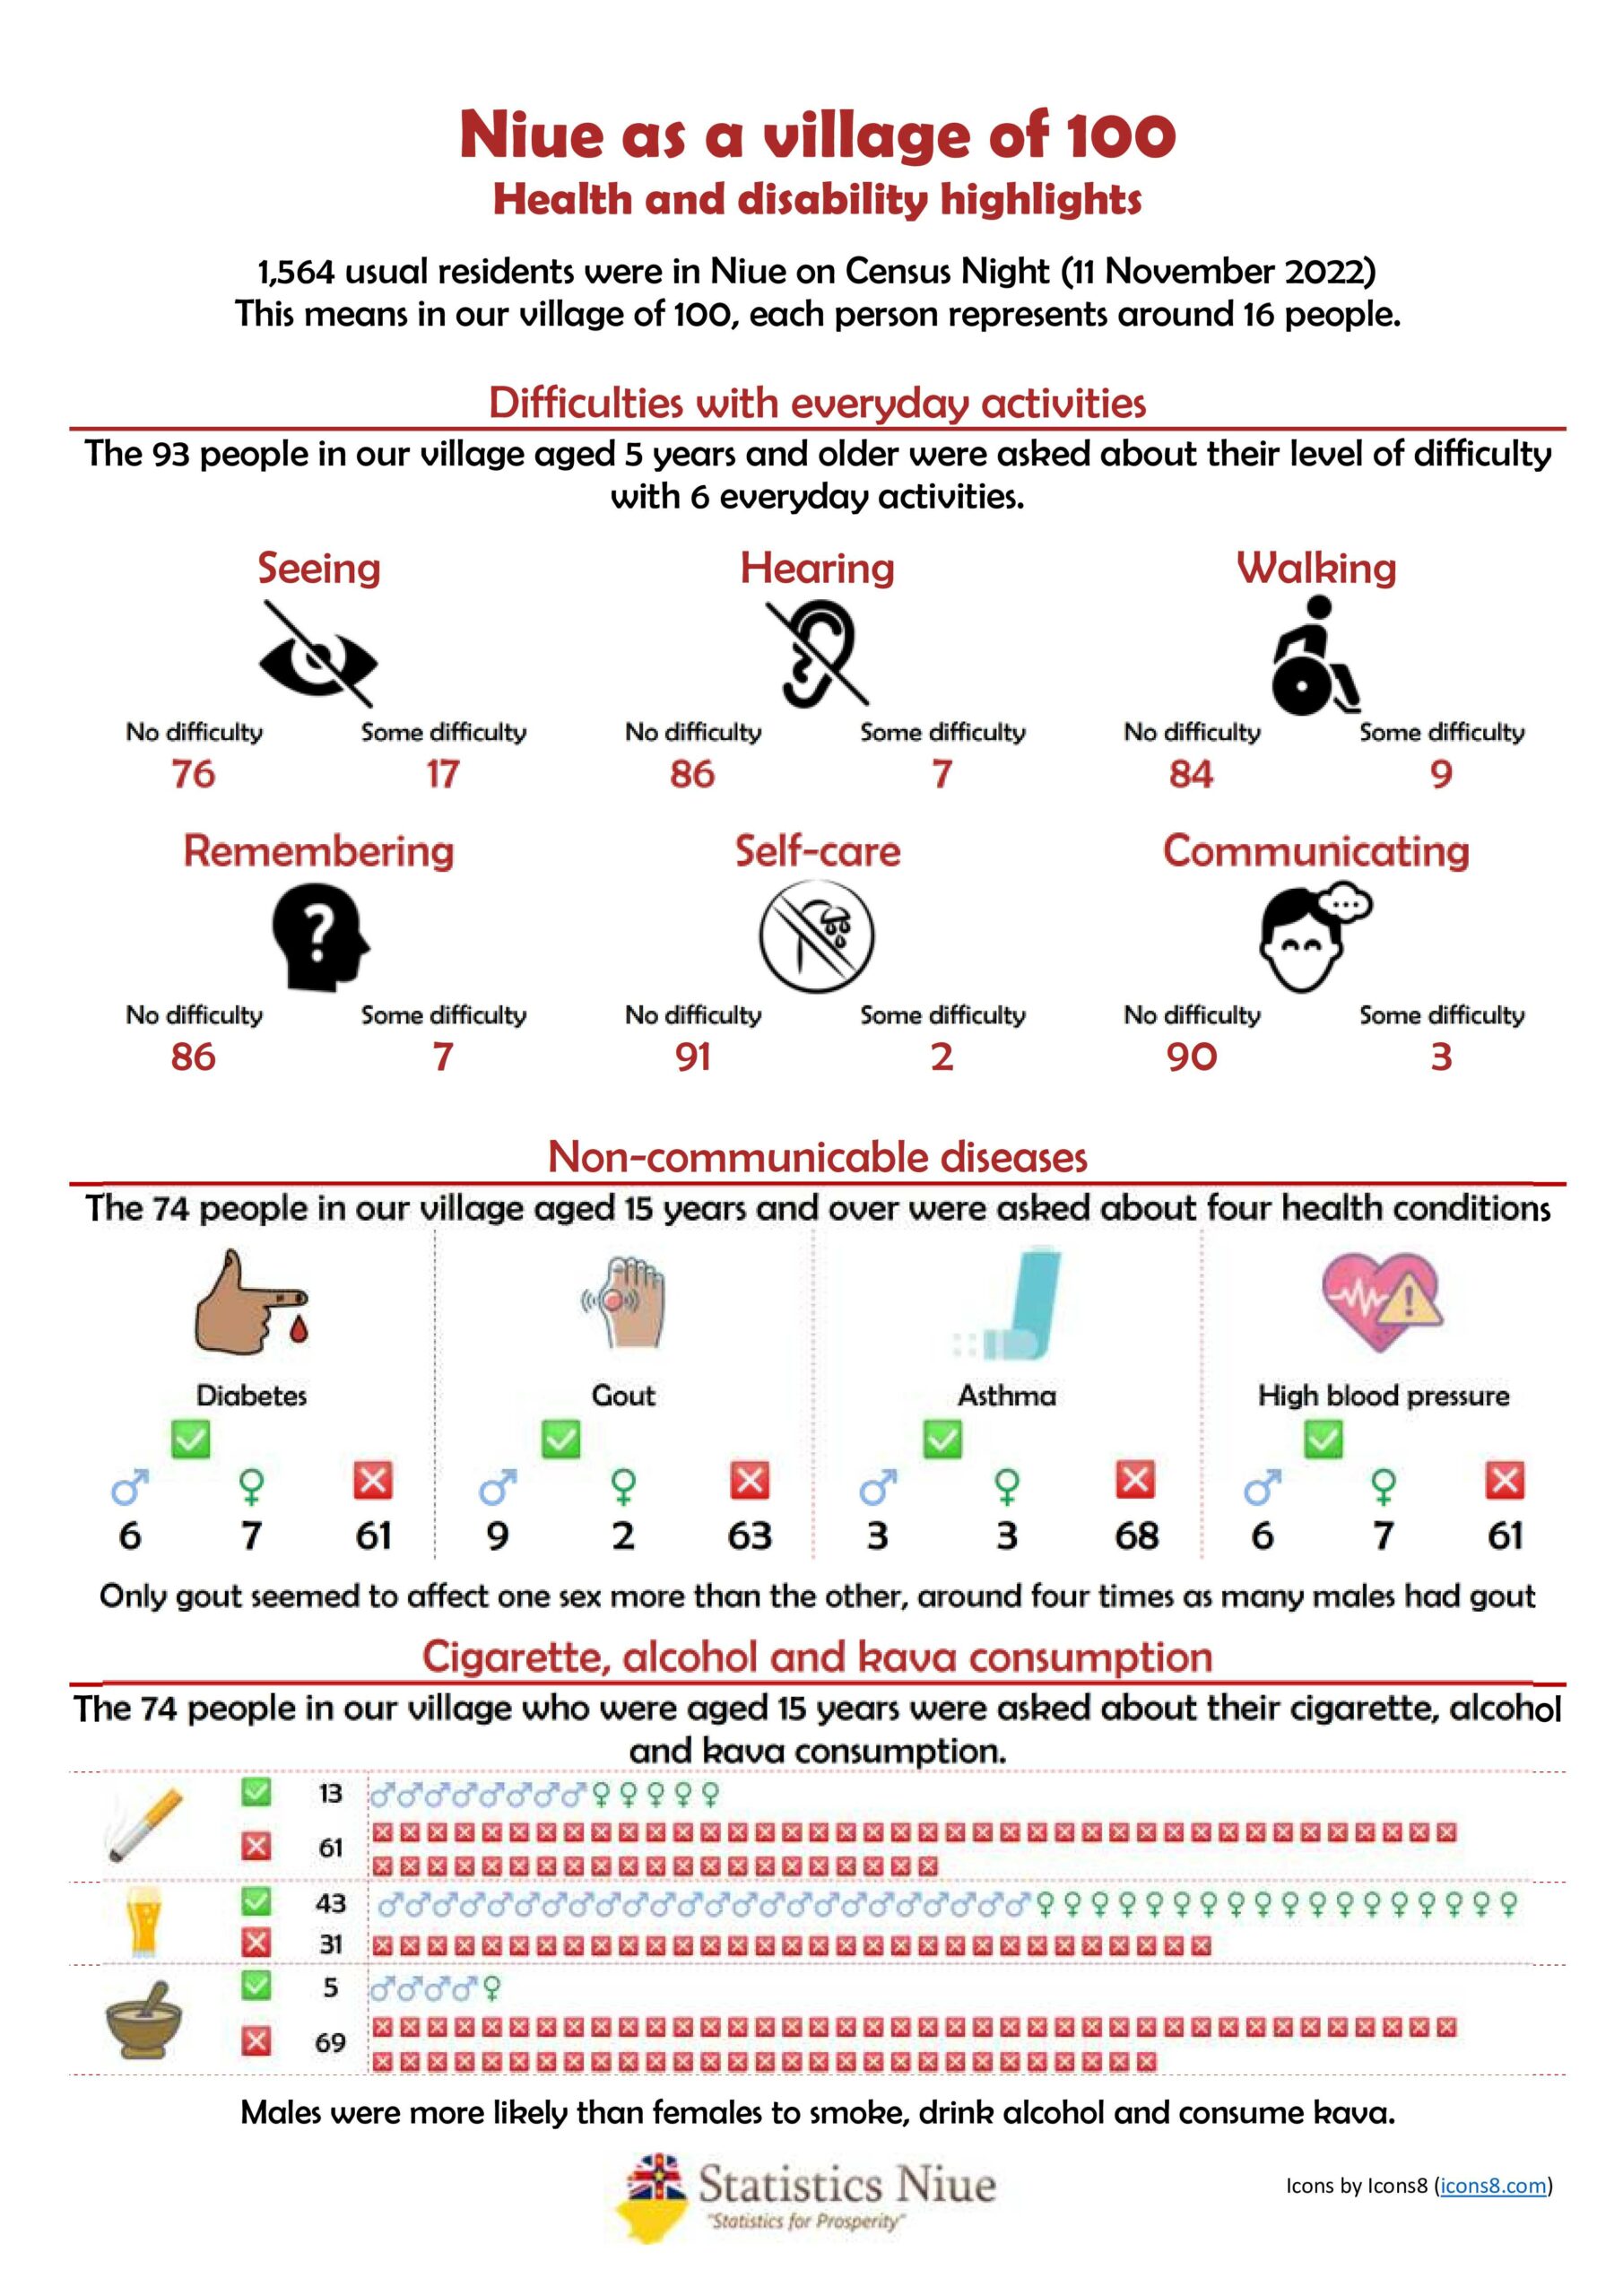
Niue began conducting censuses in 1900, although census taking was unofficial. Censuses conducted from 1902 to 1945 were conducted underNew Zealand law and also by using the Cook Islands 1961 Census Regulations. Niue’s censuses from 1971 onwards were conducted under the 1971 Niue Census Ordinance. This Ordinance was later amended in 1978.
Census data provides the official count of people and households in Niue.
Every five years, the statistics office runs the census – the official count of the population and the dwellings in Niue. By asking for the assistance of the general public to complete the questions mainly about themselves and their household, we capture a snapshot of who is living (and visiting) Niue.
The census is the only survey in Niue that covers the whole population. It provides the most complete picture of life in Niue.
Below is a summary of censuses conducted from 1997 to 2022
| Census summaries | 1997 | 2001 | 2006 | 2011 | 2017 | 2022 |
| Census population (de facto population) | 2,088 | 1,788 | 1,625 | 1,611 | 1,719 | 1,681 |
| Usual resident population | 1,538 | 1,460 | 1,591 | 1,564 | ||
| Absent population | 147 | 193 | 125 | |||
| Visiting population | 128 | 117 | ||||
| Population density (per sqkm) | 8.1 | 6.9 | 6 | 6 | 6.1 | 6.0 |
| Average annual rate of population growth (%) | -1.2 | -3.8 | -1.9 | 1.2 | -0.4 | |
| Average annual rate of growth (residents, %) | -2.4 | 1.6 | -0.3 | |||
| Percentage younger than 15 years (%) | 33 | 30 | 26.7 | 24.8 | 28.1 | 26.2 |
| Percentage 15-59 years (%) | 54 | 56 | 58.5 | 58.5 | 53.2 | 51.5 |
| Percentage 60+ years (%) | 13 | 14 | 14.8 | 16.7 | 18.7 | 22.3 |
| Percentage youths (15-24 years, %) | 16.4 | 13.4 | 10.1 | 11.8 | ||
| Median age | 27 | 29 | 30.7 | 32.8 | 33 | 35 |
| Sex ratio (M/F) | 102 | 101 | 97 | 99 | 92 | 95 |
| Dependency ratio (15-59, %) | 84.5 | 78.9 | 71 | 63 | 88.1 | 94.0 |
| Crude birth rate (CBR per 1,000) | 18.3 | 18.5 | 15.8 | 18.4 | 17.2 | |
| Crude death rate (CDR, per 1,000) | 6.6 | 7.8 | 9.3 | 8.9 | 7.2 | |
| Net migration rate | -24.0 | -48.7 | -30.5 | -2.1 | 0.56 | |
| Average annual number of births | 41 | 29 | 26 | 28 | 26.2 | |
| Average annual number of deaths | 45 | 16 | 15 | 12 | 10.9 | |
| Average annual number of net migrants | -51 | -88 | -50 | -211 | 2.2 | |
| Average household size | 3.8 | 3.4 | 3.2 | 3.1 | 3.3 | 3.0 |
| Total fertility rate (TFR) | 3 | 3.04 | 2.6 | 2.2 | 3.03 | 2.94 |
| Life Expectancy at birth, total | 69.5 | 70.1 | 73.9 | |||
| Life expectancy at birth, males | 68.8 | 67 | 72.5 | 72.8 | ||
| Life expectancy at birth, females | 71.2 | 76 | 75.2 | 79.8 | ||
| Infant mortality rate (IMR) | 17.5 | 29.4 | 1 death in 5 years | 1 death in 5 years | 0.0* |

